Pittsburgh Is Losing Both Jobs and Population
Three years ago, when the country was struggling to recover from the recession, the Pittsburgh Region had the sixth highest job growth rate of any major region in the country. In contrast, this year, when most major metropolitan regions are experiencing job growth rates of 2% per year or more, Pittsburgh is actually losing jobs. Between February 2013 and February 2014, Southwestern Pennsylvania lost 5,200 jobs, the biggest loss in percentage terms among the top 40 regions in the country.
The loss of jobs wasn’t just something unusual that happened in February; the Pittsburgh Region has been losing jobs every month since the end of last year, and the losses have been getting bigger. Moreover, these job losses are coming on the heels of surprising news that job creation in Pittsburgh in 2013 was much smaller than what many had believed. Reports last fall indicated that the region had created over 20,000 net new jobs, but in reality, there were only 400 more jobs here in 2013 than 2012. (Each spring, the U.S. Bureau of Labor Statistics (BLS) replaces the previous year’s estimates with actual figures based on the results of a complete census of businesses. It turned out that BLS had significantly over-estimated the number of jobs in Pittsburgh in 2013.)
 The combination of minuscule job growth in 2013 followed by large job losses at the beginning of 2014 means that Pittsburgh has fewer jobs today than it did two years ago, the only major region in the country with that unfortunate distinction. What’s worse, the Pittsburgh Region has 7,000 fewer jobs today than it did thirteen years ago, while most regions have added tens of thousands of jobs during that same time period.

You might be puzzled as to how Pittsburgh could be losing so many jobs when news stories have been reporting that the region’s unemployment rate has been declining. The big reduction in the unemployment rate from 8.6% in January 2013 to 6.5% in January 2014 wasn’t because a lot of unemployed workers found jobs, but because nearly 29,000 unemployed workers stopped looking for work altogether and dropped out of the labor force. In other words, a drop in the unemployment rate isn’t always good news.
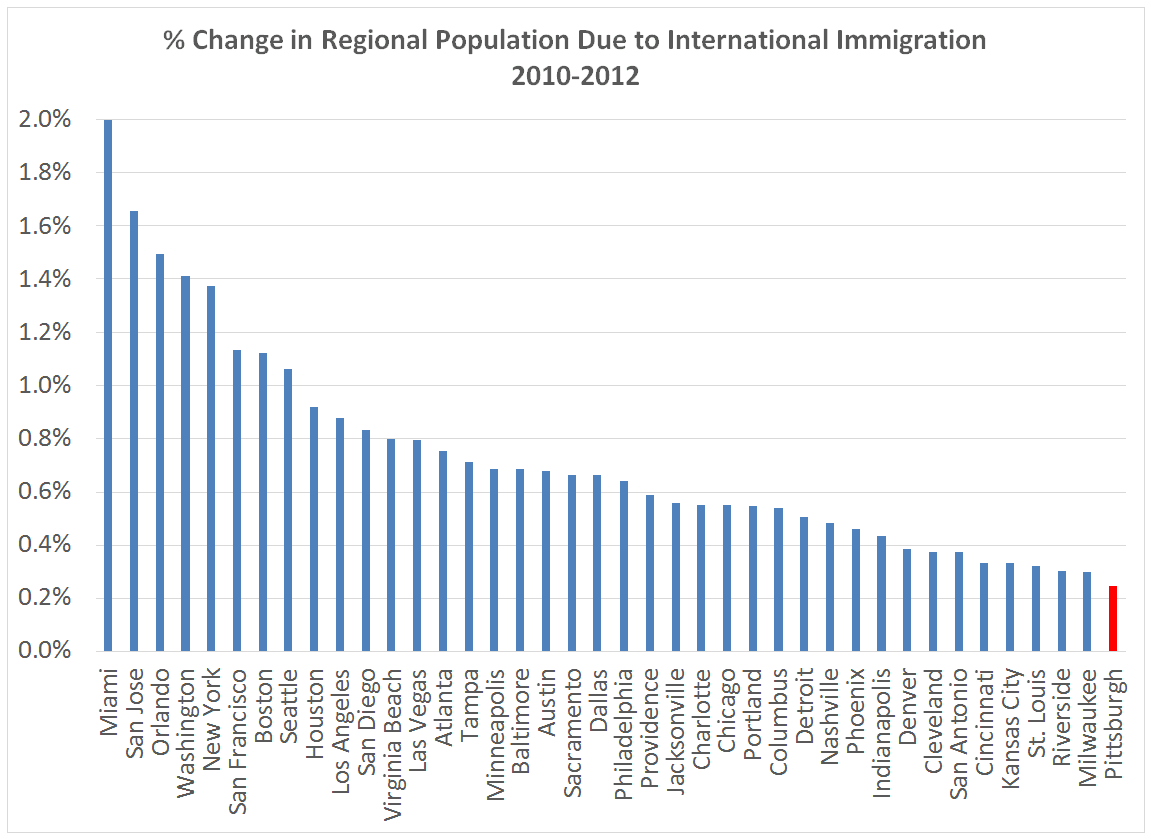
The labor data don’t tell us whether the people who stopped looking for work are still living here or if they moved out of the region altogether in order to look for a job. We’ll have a better sense of that next year when the Census Bureau releases the population estimates for 2014. However, it seems likely that continued job losses could cause population losses in the region. In 2011, the year that jobs were growing faster here than in most other regions, we had more population in-migration than any other year in the past decade. Since then, our job growth has fallen behind other regions, and our rate of in-migration has also declined. Although more people moved in than moved out between 2012 and 2013, our rate of in-migration was lower than in previous years, and it was not enough to offset the fact that the region had more deaths than births. As a result, Pittsburgh was the only major metropolitan area in the country that actually lost population in 2013.
There’s no one reason we’ve been losing jobs. Most economic sectors in the region lost jobs over the past year, including manufacturing, higher education, finance, government, construction, retail, and professional and business services. However, the biggest loss by far was in manufacturing. While the majority of major regions in the country were adding manufacturing jobs over the past year, Pittsburgh lost 2,800 manufacturing jobs, the fourth highest rate of loss among the top 40 regions. Pittsburgh’s inability to attract and retain manufacturing businesses is a serious problem, not only because of the high wages paid for manufacturing jobs, but because of the large number of other businesses and jobs they support in the region’s economy.
 The sector that created the largest number of new jobs over the past year is leisure and hospitality. While 1,400 more jobs in the leisure and hospitality industry are certainly welcome, those jobs have the lowest average wages of any sector, paying only one-third as much as manufacturing jobs, so they don’t come close to replacing the high-wage jobs we’ve lost in other sectors.
The latest data on jobs and population should be a wake-up call for the region. Promoting the region’s great quality of life won’t do much good if prospective residents can’t find jobs. We can’t assume that “eds and meds” will continue to create new jobs here year after year when there is growing pressure to reduce healthcare spending and growing concern about the high cost of higher education. We can’t blame federal policies for slow growth when every other major region in the country is creating more jobs than we are.
Two of the most important ways we can encourage more job growth and population growth are:
Improving the region’s business climate. It’s hard to attract and retain businesses in a state with the second highest corporate income tax rate in the nation and a reputation for a difficult-to-navigate regulatory maze. It’s impossible to attract and retain manufacturing businesses if they can’t find the industrial sites, buildings, and skilled workers here that they can find in other regions. Both state and local government leaders need to ensure the region provides a competitive environment for all types of businesses. Improving the state’s business climate needs to be a top issue in this year’s gubernatorial campaign.
Encouraging entrepreneurship. Most new jobs are created by startups, not established firms, but our region has had one of the lowest rates of new business formation in the nation. As described in more detail in a previous post, we need more local seed and venture capital to support startups, more small business lending by banks, and greater willingness by local businesses to become customers for the products and services that local entrepreneurs produce.
(A version of this post appeared as the Regional Insights column in the Sunday, April 6, 2014 edition of the Pittsburgh Post-Gazette.)
The loss of jobs wasn’t just something unusual that happened in February; the Pittsburgh Region has been losing jobs every month since the end of last year, and the losses have been getting bigger. Moreover, these job losses are coming on the heels of surprising news that job creation in Pittsburgh in 2013 was much smaller than what many had believed. Reports last fall indicated that the region had created over 20,000 net new jobs, but in reality, there were only 400 more jobs here in 2013 than 2012. (Each spring, the U.S. Bureau of Labor Statistics (BLS) replaces the previous year’s estimates with actual figures based on the results of a complete census of businesses. It turned out that BLS had significantly over-estimated the number of jobs in Pittsburgh in 2013.)
You might be puzzled as to how Pittsburgh could be losing so many jobs when news stories have been reporting that the region’s unemployment rate has been declining. The big reduction in the unemployment rate from 8.6% in January 2013 to 6.5% in January 2014 wasn’t because a lot of unemployed workers found jobs, but because nearly 29,000 unemployed workers stopped looking for work altogether and dropped out of the labor force. In other words, a drop in the unemployment rate isn’t always good news.
The labor data don’t tell us whether the people who stopped looking for work are still living here or if they moved out of the region altogether in order to look for a job. We’ll have a better sense of that next year when the Census Bureau releases the population estimates for 2014. However, it seems likely that continued job losses could cause population losses in the region. In 2011, the year that jobs were growing faster here than in most other regions, we had more population in-migration than any other year in the past decade. Since then, our job growth has fallen behind other regions, and our rate of in-migration has also declined. Although more people moved in than moved out between 2012 and 2013, our rate of in-migration was lower than in previous years, and it was not enough to offset the fact that the region had more deaths than births. As a result, Pittsburgh was the only major metropolitan area in the country that actually lost population in 2013.
There’s no one reason we’ve been losing jobs. Most economic sectors in the region lost jobs over the past year, including manufacturing, higher education, finance, government, construction, retail, and professional and business services. However, the biggest loss by far was in manufacturing. While the majority of major regions in the country were adding manufacturing jobs over the past year, Pittsburgh lost 2,800 manufacturing jobs, the fourth highest rate of loss among the top 40 regions. Pittsburgh’s inability to attract and retain manufacturing businesses is a serious problem, not only because of the high wages paid for manufacturing jobs, but because of the large number of other businesses and jobs they support in the region’s economy.
The latest data on jobs and population should be a wake-up call for the region. Promoting the region’s great quality of life won’t do much good if prospective residents can’t find jobs. We can’t assume that “eds and meds” will continue to create new jobs here year after year when there is growing pressure to reduce healthcare spending and growing concern about the high cost of higher education. We can’t blame federal policies for slow growth when every other major region in the country is creating more jobs than we are.
Two of the most important ways we can encourage more job growth and population growth are:
Improving the region’s business climate. It’s hard to attract and retain businesses in a state with the second highest corporate income tax rate in the nation and a reputation for a difficult-to-navigate regulatory maze. It’s impossible to attract and retain manufacturing businesses if they can’t find the industrial sites, buildings, and skilled workers here that they can find in other regions. Both state and local government leaders need to ensure the region provides a competitive environment for all types of businesses. Improving the state’s business climate needs to be a top issue in this year’s gubernatorial campaign.
Encouraging entrepreneurship. Most new jobs are created by startups, not established firms, but our region has had one of the lowest rates of new business formation in the nation. As described in more detail in a previous post, we need more local seed and venture capital to support startups, more small business lending by banks, and greater willingness by local businesses to become customers for the products and services that local entrepreneurs produce.
(A version of this post appeared as the Regional Insights column in the Sunday, April 6, 2014 edition of the Pittsburgh Post-Gazette.)
posted by Harold D. Miller at 8:21 AM
0 comments
![]()
![]()